
So you want to track your baby's feedings and dirty diapers?
Most digital solutions for newborn feeding trackers are either pricey or don't make it easy for more than one person recording the feedings. I put together a convenient solution with minimal investment.
First, the why?
- I wanted a convenient solution where recording the data was quick, reliable and easy.
- I wanted more than one person recording the data.
- Once recorded, I wanted to be able to load the data into Excel or R and do some data analysis.
- I did not want to do data entry to transfer the data from analog to digital.
- I did not want to create a phone app or a web app as the front-end.
- I did not want to maintain a data persistence back-end (e.g. don't want to maintain my own database no matter how simple!).
Now, the how?
Entering the data
I put together a simple and convenient solution using a private Twitter account, the twitteR R package and R. The basic flow goes something like this:
- You feed the baby.
- Using a single private Twitter account, tweet something like "60ml breastmilk." Any Twitter client will do, iOS, Android, WP, Web, etc.
- If the baby has dirty diapers, tweet "poop," "pee" or "poop, pee."
- And that's all!
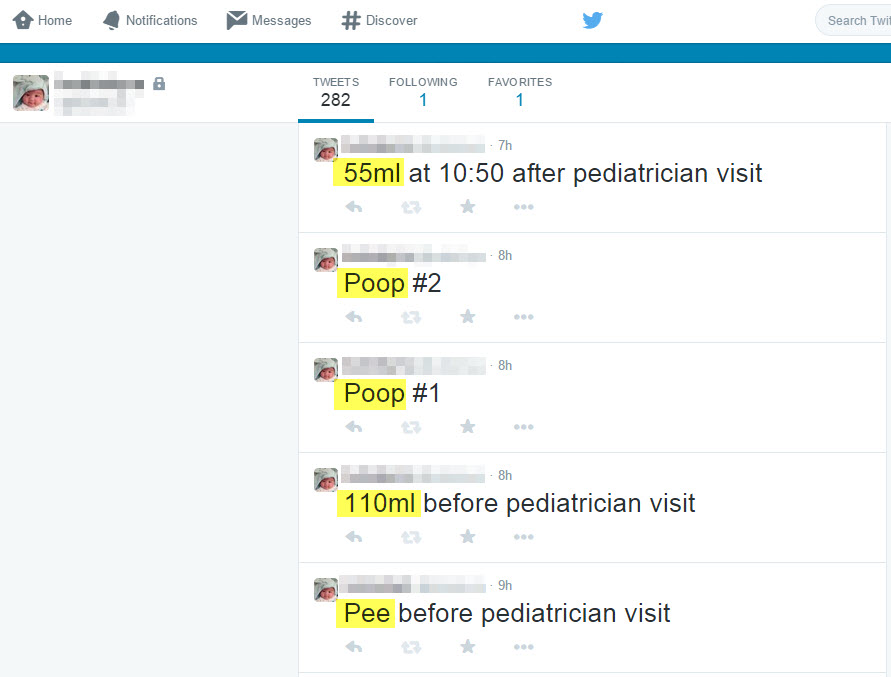
Everyone uses the same Twitter account to record the data. The private Twitter feed is essentially a baby log that looks something like the screenshot below. The highlighted portions are picked up by the data analysis script.
Analyzing the data
If you're just looking to see when the baby was last fed, you can browse the feed. However, if you're looking to do a bit more aggregation, that's where R comes into the picture.
The R implementation is the brains of this solution. As long as the folks tweeting are relatively consistent in how they log feedings, dirty diapers and anything of interest, the data analysis portion can be tweaked to extract the relevant bits of information.
Launch R, install the twitteR R package, and use the package functions to access the feed. Once the data is pulled from Twitter into an R data frame, you can slice and dice the data to get daily totals, % breastmilk, number of dirty diapers, time between feedings... it's endless! 🙂
The R implementation is coming in two follow-up posts: entering the data and analyzing the data.
What didn't work?
For a while, we went with a paper notebook when we had various in-laws caring for the baby. This worked well except that doing any sort of data analysis meant doing a lot of data entry. It also meant deciphering handwriting and incorrect entries.
Tune in for the next post with implementation details!
Comments 2
What is meant by Twitter Handle
Author
A Twitter handle is your personal ID on https://twitter.com. For example, the Hacker Bits Twitter account is found at https://twitter.com/hackerbits. The Twitter handle is “hackerbits” (without the quotes).